The H function
The full system F is a chain of the CNN G to produce probability distribution from the input, and H which predicts the final pixel value based on the outputs of G. This covers the entire algorithm.
I looked at G yesterday, so today I’ll define the H function.
There are a number of options to convert the probability distribution to pixel values.
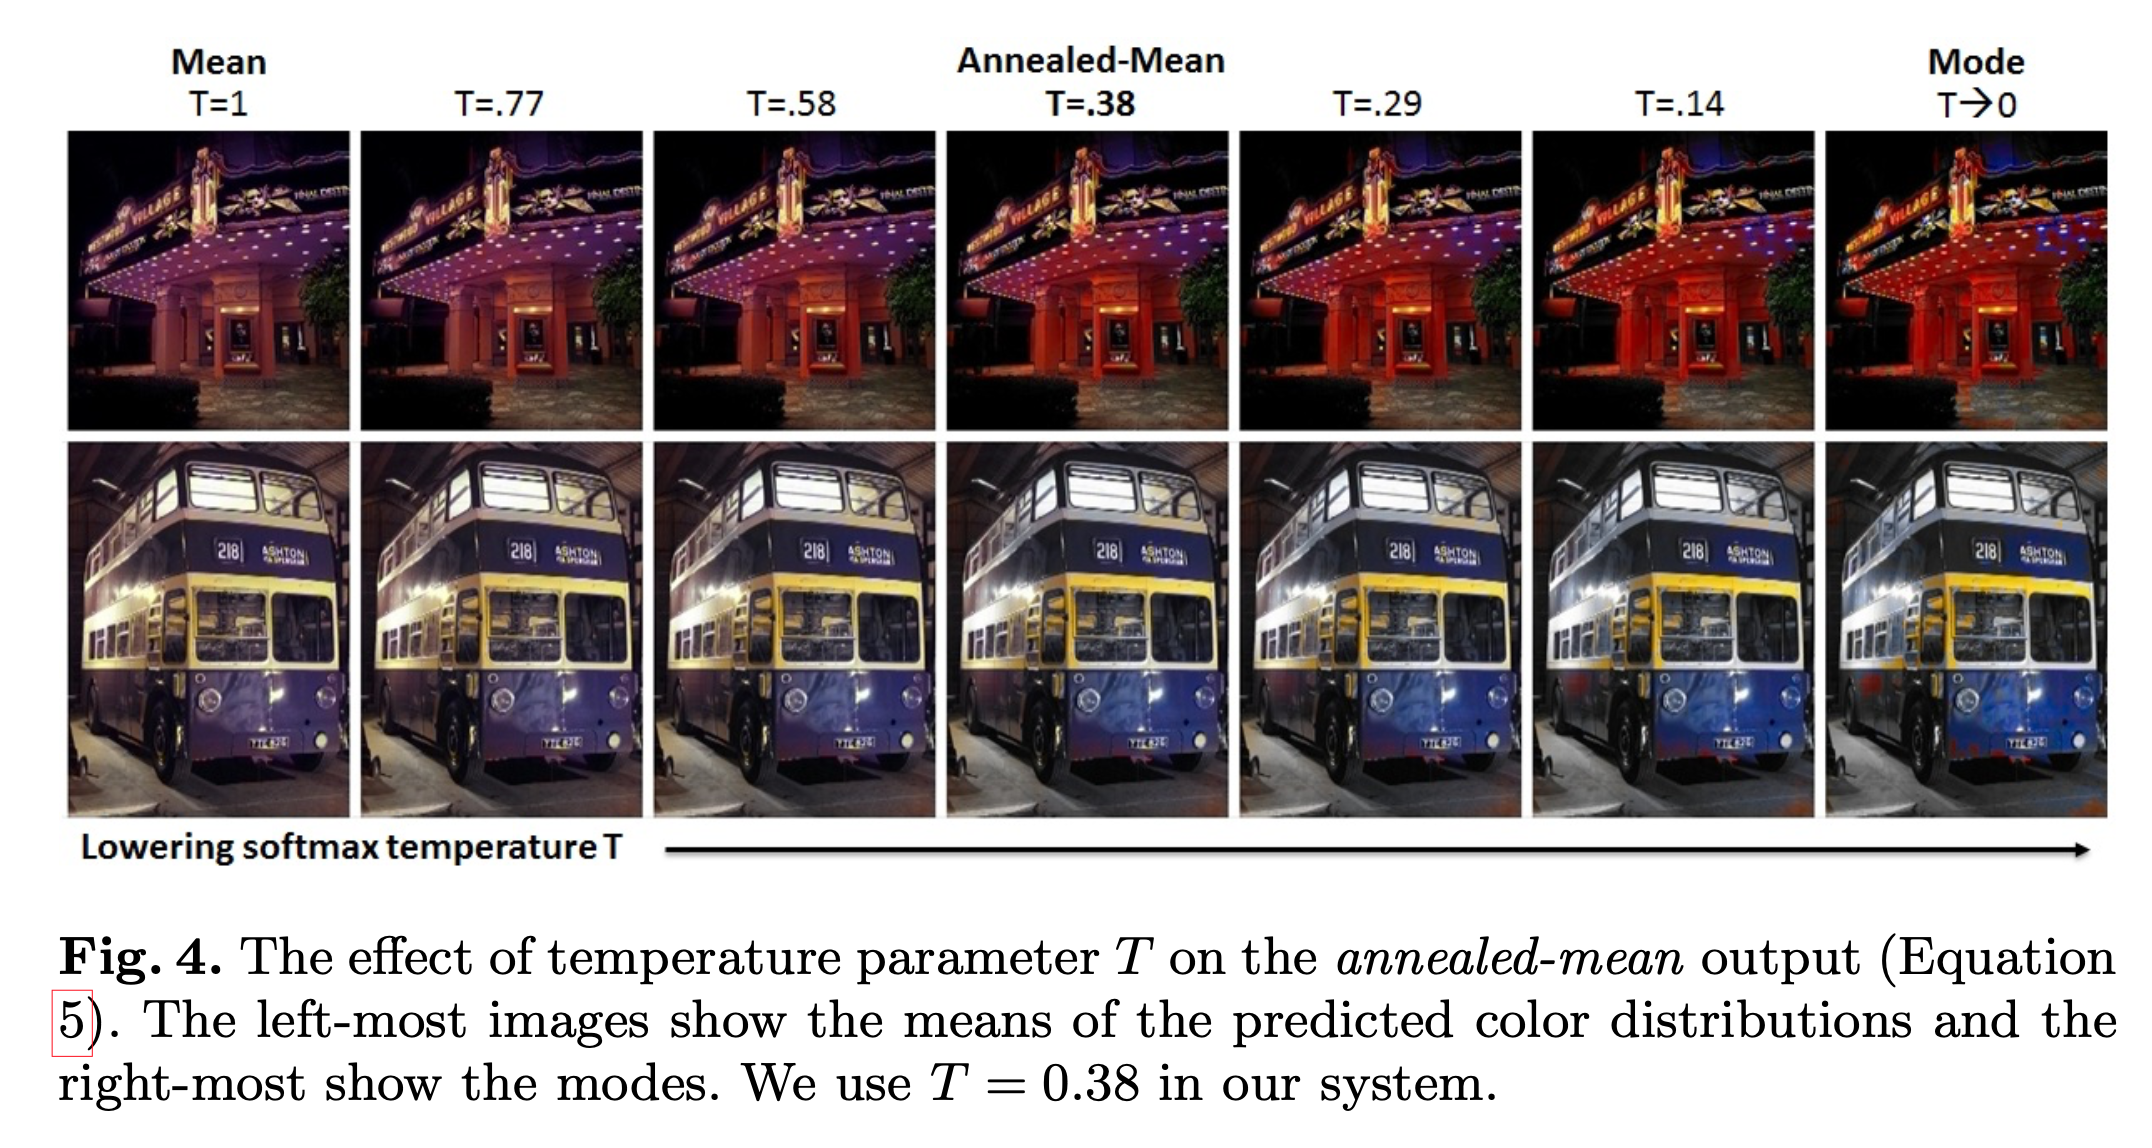
Mode You can use the mode of the probability distribution to return Y_hat. This is shown as the right most images in fig 4. It gives vibrant colors but at the expense of spatially inconsistent results. See the red spot on the bus.
Mean The mean produces a spatially consistent result, at the expense of color vibrancy.
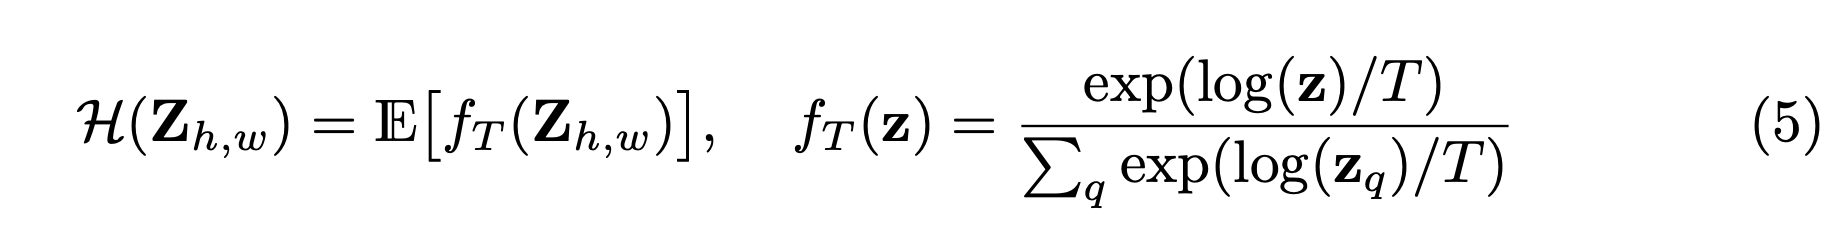
Annealed Mean The authors choose to interpolate between the mean and mode to attempt the best of both worlds. There is a parameter T which corresponds to the temperature of the softmax distributions, which can be adjusted. They then take the mean of that readjustment.